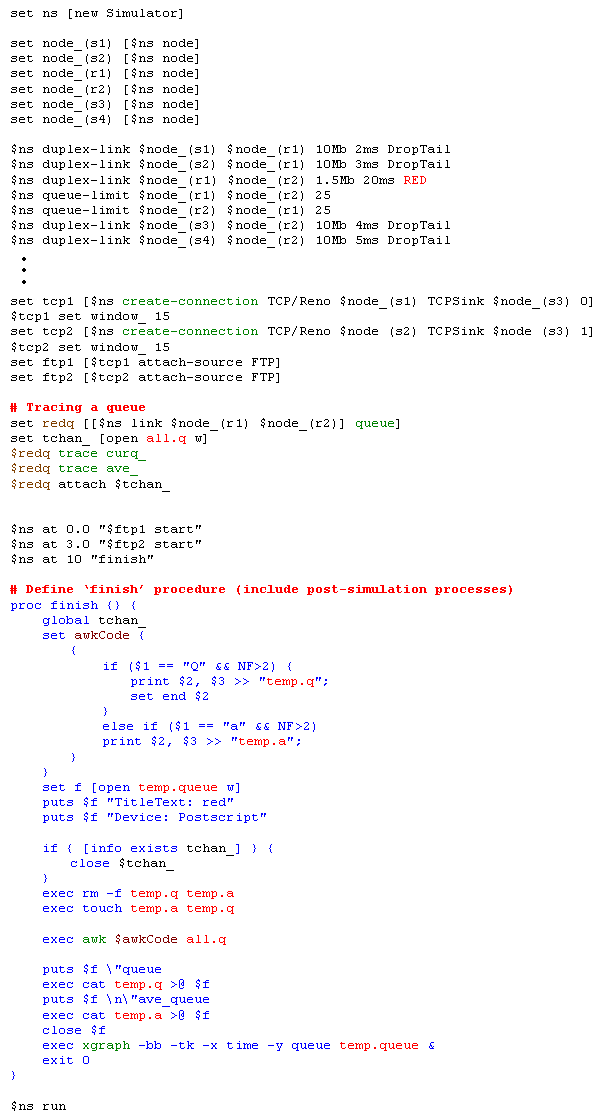
This section shows a RED queue monitoring example. Example 5 is an OTcl script written by Polly Huang, which sets up the network topology and runs the simulation scenario shown in Figure 15. Note that a RED queue that can hold up to 25 packets is used for the link r1-r2, and we want to see how the RED queue works by measuring the dynamics of current and average queue size. To run this script, download "red.tcl" and type "ns red.tcl" at your shell prompt.

Figure 15. RED Queue Monitor Example Setup

Example 5. RED Queue Monitor Simulation Script
There are couple of things to note in the above script. First, more advanced Simulator object member function create-connection is used to create TCP connections. Second, take a good look at queue tracing (monitoring) part of the script. These lines make a variable to point the RED queue object, call its member function trace to monitor the current queue size (curq_) and average queue size (avg_), and make them write the results to the file "all.q". Following are the two queue trace output formats for average queue size and current queue size.
|
a time avg_q_size Q time crnt_q_size |
Now that the all commands needed for RED queue monitoring is done except closing the "all.q" file when the simulation is done, the remaining work designs a post-simulation process. This script, using awk, does this process of transforming the monitored information into XGraph (a plotter) input format, and launches it to draw the given information (see Figure 16).

Figure 16. Red Queue Trace Graph